
Compare KPI charts vs last week
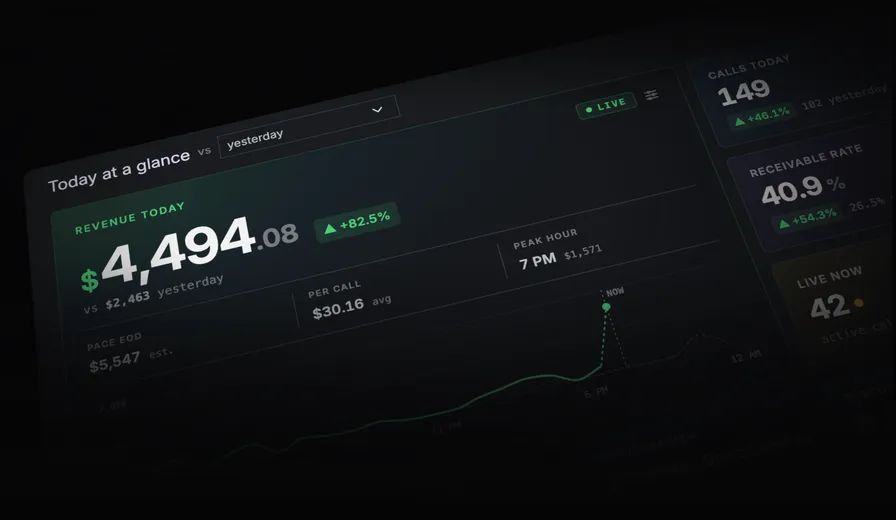
On your Overview Dashboard (homepage) you can now change the comparision period on the “Today at a glance” KPI charts.
Compare Today vs:
- Yesterday (old default)
- Last week
- 4 weeks ago

The goal of this chart is to quickly tell you “how are we performing today” and most importantly “is anything on fire”.
We’ve improved how the comparision chart is generated to make this clearer by comparing vs last week as default. So if you are looking at your Monday calls you’ll see vs last Monday, instead of vs Sunday (which may have had few calls and confusingly look like a drop in traffic).
“Same time last week” is now the new default, any option you select will be remembered next time you visit.
The dotted grey line = the previous period

The chart now shows a dotted line in the background representing your selected previous period (ie, showing the full day last week). There is also now an “NOW” indicator, previously it was always full width, now the current time is clearly shown. Finally the green dotted line means “my calls for the this hour period”, so if it’s 9:20am, it will be calls from 9am - 9:20am.
Help us improve this article or request new support guides.