
Announcing RTB Dashboard 2.0

The RTB Dashboard is the primary window into your Real-Time Bidding activity. Every request you receive from publishers, every target evaluation, every bid you return.
Before 2.0, inbound requests and outbound target resolutions were mixed together in a single view, which made it difficult to answer straightforward questions like “why are we not bidding on this publisher’s traffic?” or “which buyer is slowest to evaluate?”. Metrics like “Average Time to Resolve” and “Bid Percentage” meant completely different things depending on whether you were looking at an inbound or outbound row, but there was no way to tell them apart at a glance.
The new RTB Dashboard 2.0 gives each side of the auction its own dedicated view so you can monitor, drill down, and act on problems faster:
- Inbounds are requests that your company has received and how your company has responded to them.
- Outbounds are requests that your company has made to your buyers for bids and how those buyers have responded to your requests.
This matters because RTB operates in milliseconds where a slow resolution or a misconfigured target can silently cost you revenue on every request. If you can’t quickly isolate whether a problem is on the inbound side (how you’re handling publisher requests) or the outbound side (how individual buyers are performing), diagnosing issues takes longer and money is left on the table.
What’s new on the inbound page?
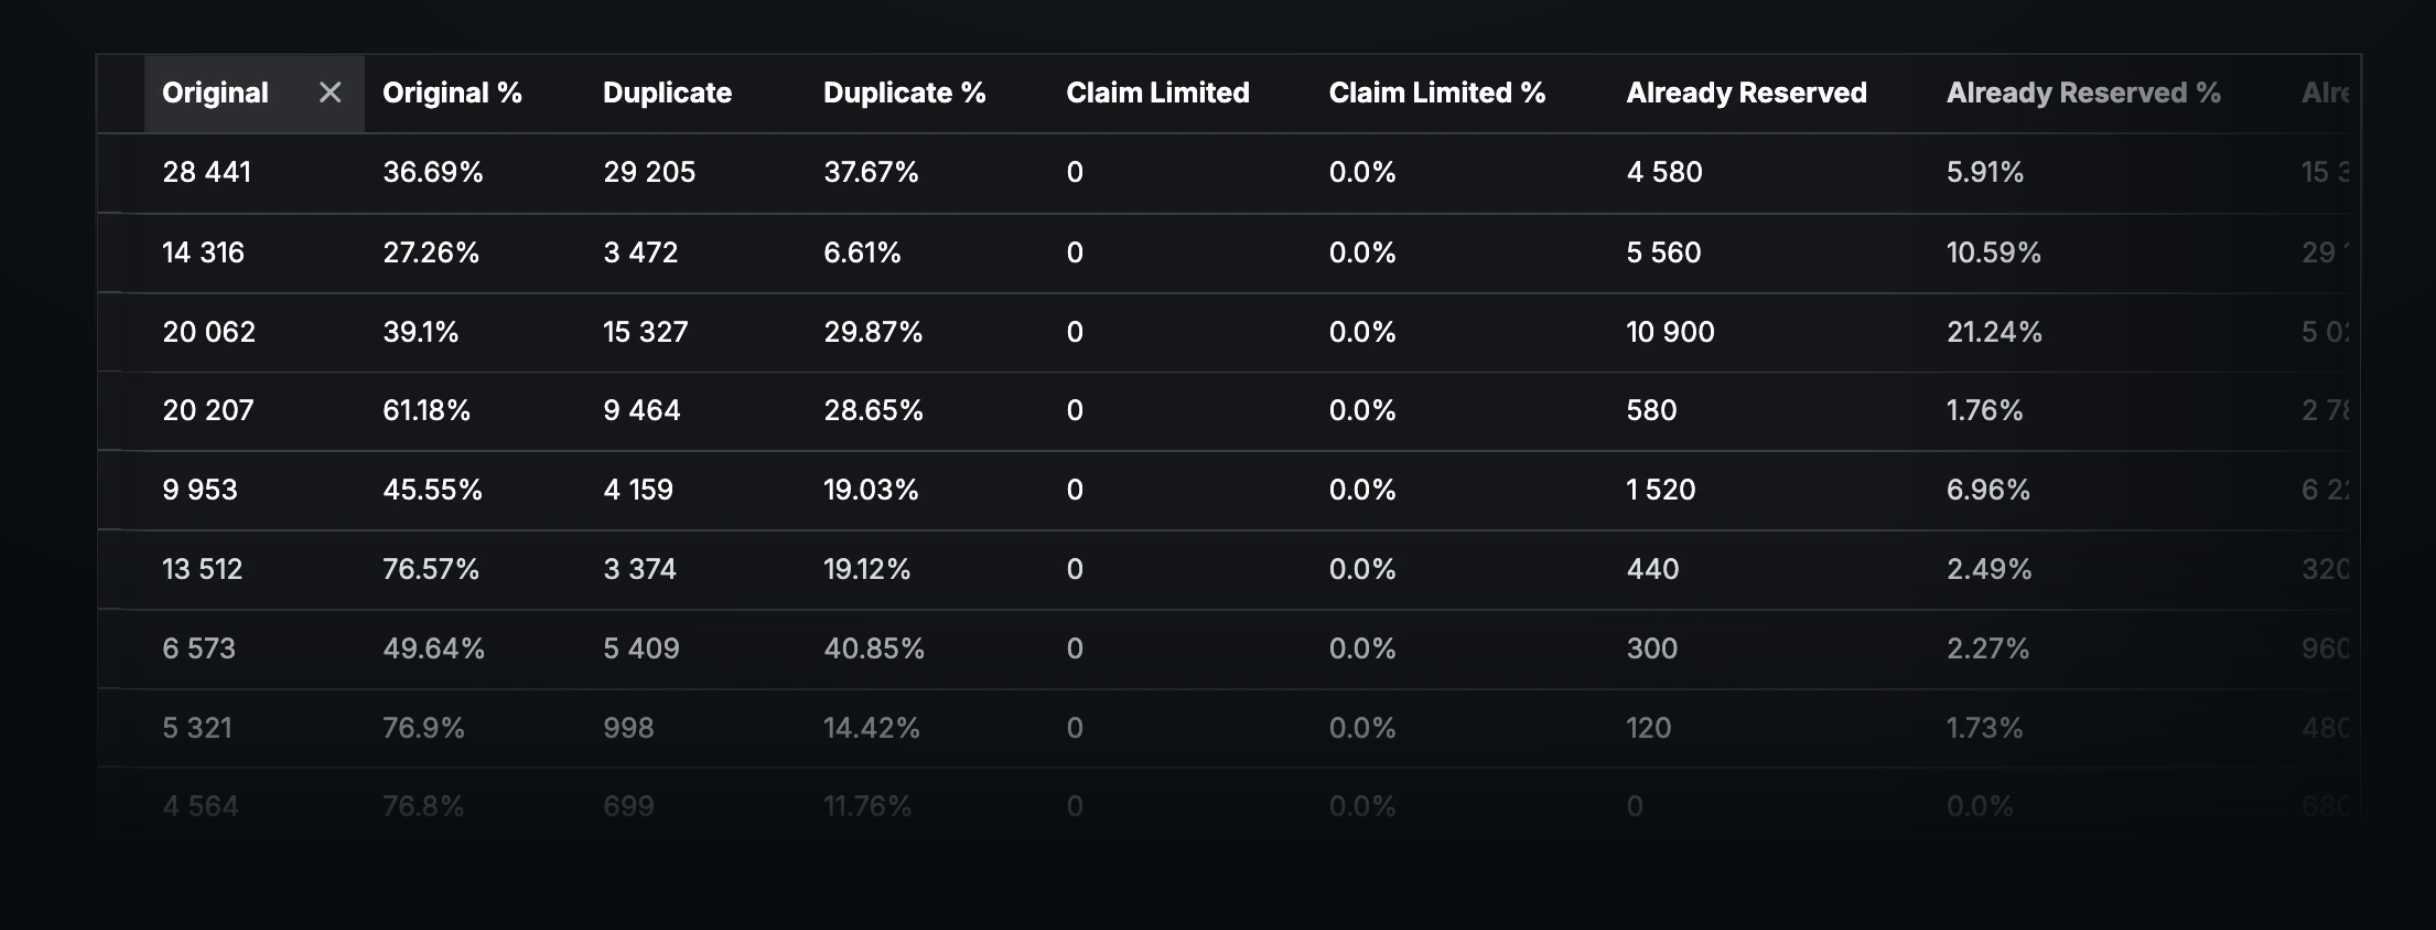
A comprehensive inbound oriented drill-down table
We’re introducing a new batch of columns that we believe would be helpful for you to optimize your campaigns with. Those include:
- Original - how many requests were the first (non-duplicate) request for a caller
- Original % - share of requests that were originals
- Duplicate - how many requests were duplicates of an earlier request
- Duplicate % - share of requests that were duplicates
- Bid % - how often we responded with a bid
- No Bid % - how often we did not bid
- Average Bid Returned - average payout amount when we did bid
- Average Winning Bid - average payout on bids that resulted in a claimed call
- Average Time to Resolve - average time to send a response back to the publisher
- P95 Time to Resolve - slowest 5% response time, useful for spotting performance issues.
A simpler RTB Log
The RTB Log now contains 1 entry for each RTB request you’ve received, it contains all of the information you may require to understand what happened with a RTB request sent by your publisher in a single place. Including which buyers were considered for routing.
See the new inbounds dashboard today: https://retreaver.com/rtb_inbounds_dashboard
What’s new on the outbound page?
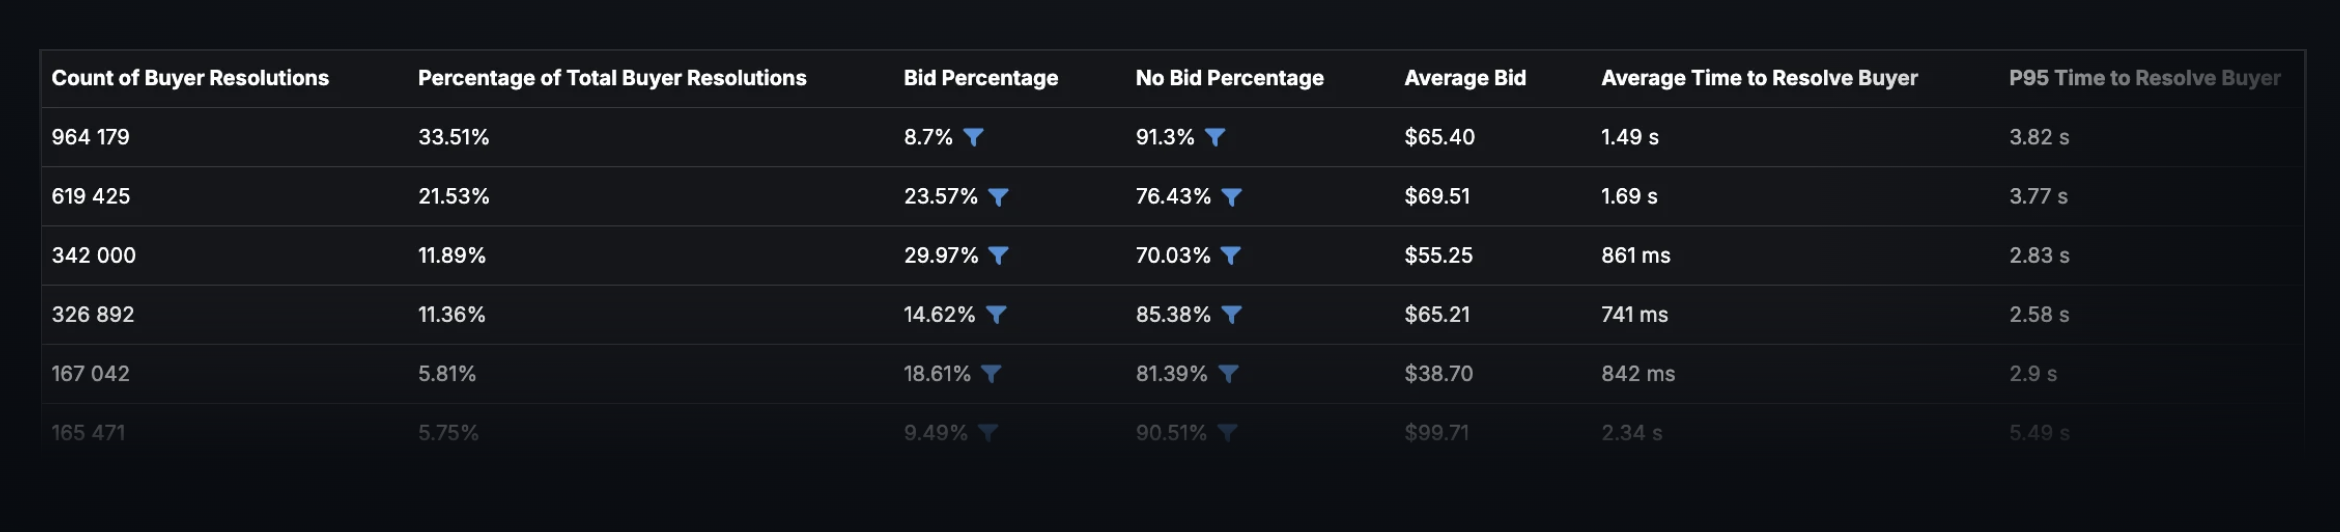
A comprehensive buyer oriented drill-down table
We’re introducing a new batch of columns that we believe would be helpful for you to better understand your buyers and their bidding patterns:
- Bid Percentage - how often the buyer placed a bid
- No Bid Percentage - how often the buyer did not bid
- Average Bid - average bid amount when the buyer did bid
- Average Time to Resolve - average time to decide whether a target should be included in routing
- P95 Time to Resolve - slowest 5% decision time for target evaluation
See the new outbounds dashboard today: https://retreaver.com/rtb_outbounds_dashboard
Help us improve this article or request new support guides.
Previous
Analyze your inbound RTB traffic — in the dashboard, via API, or by asking an AI assistant
Next
Set Default Tag Values for Buyer Webhooks