The All-New Overview Dashboard

Why this matters
The new Overview does a lot of your work for you the instant you land on it. Instead of asking “how are we doing?”, you get the answer — including the one question every operator cares about: how much am I going to earn by the end of the day if I keep at this pace?
What’s new
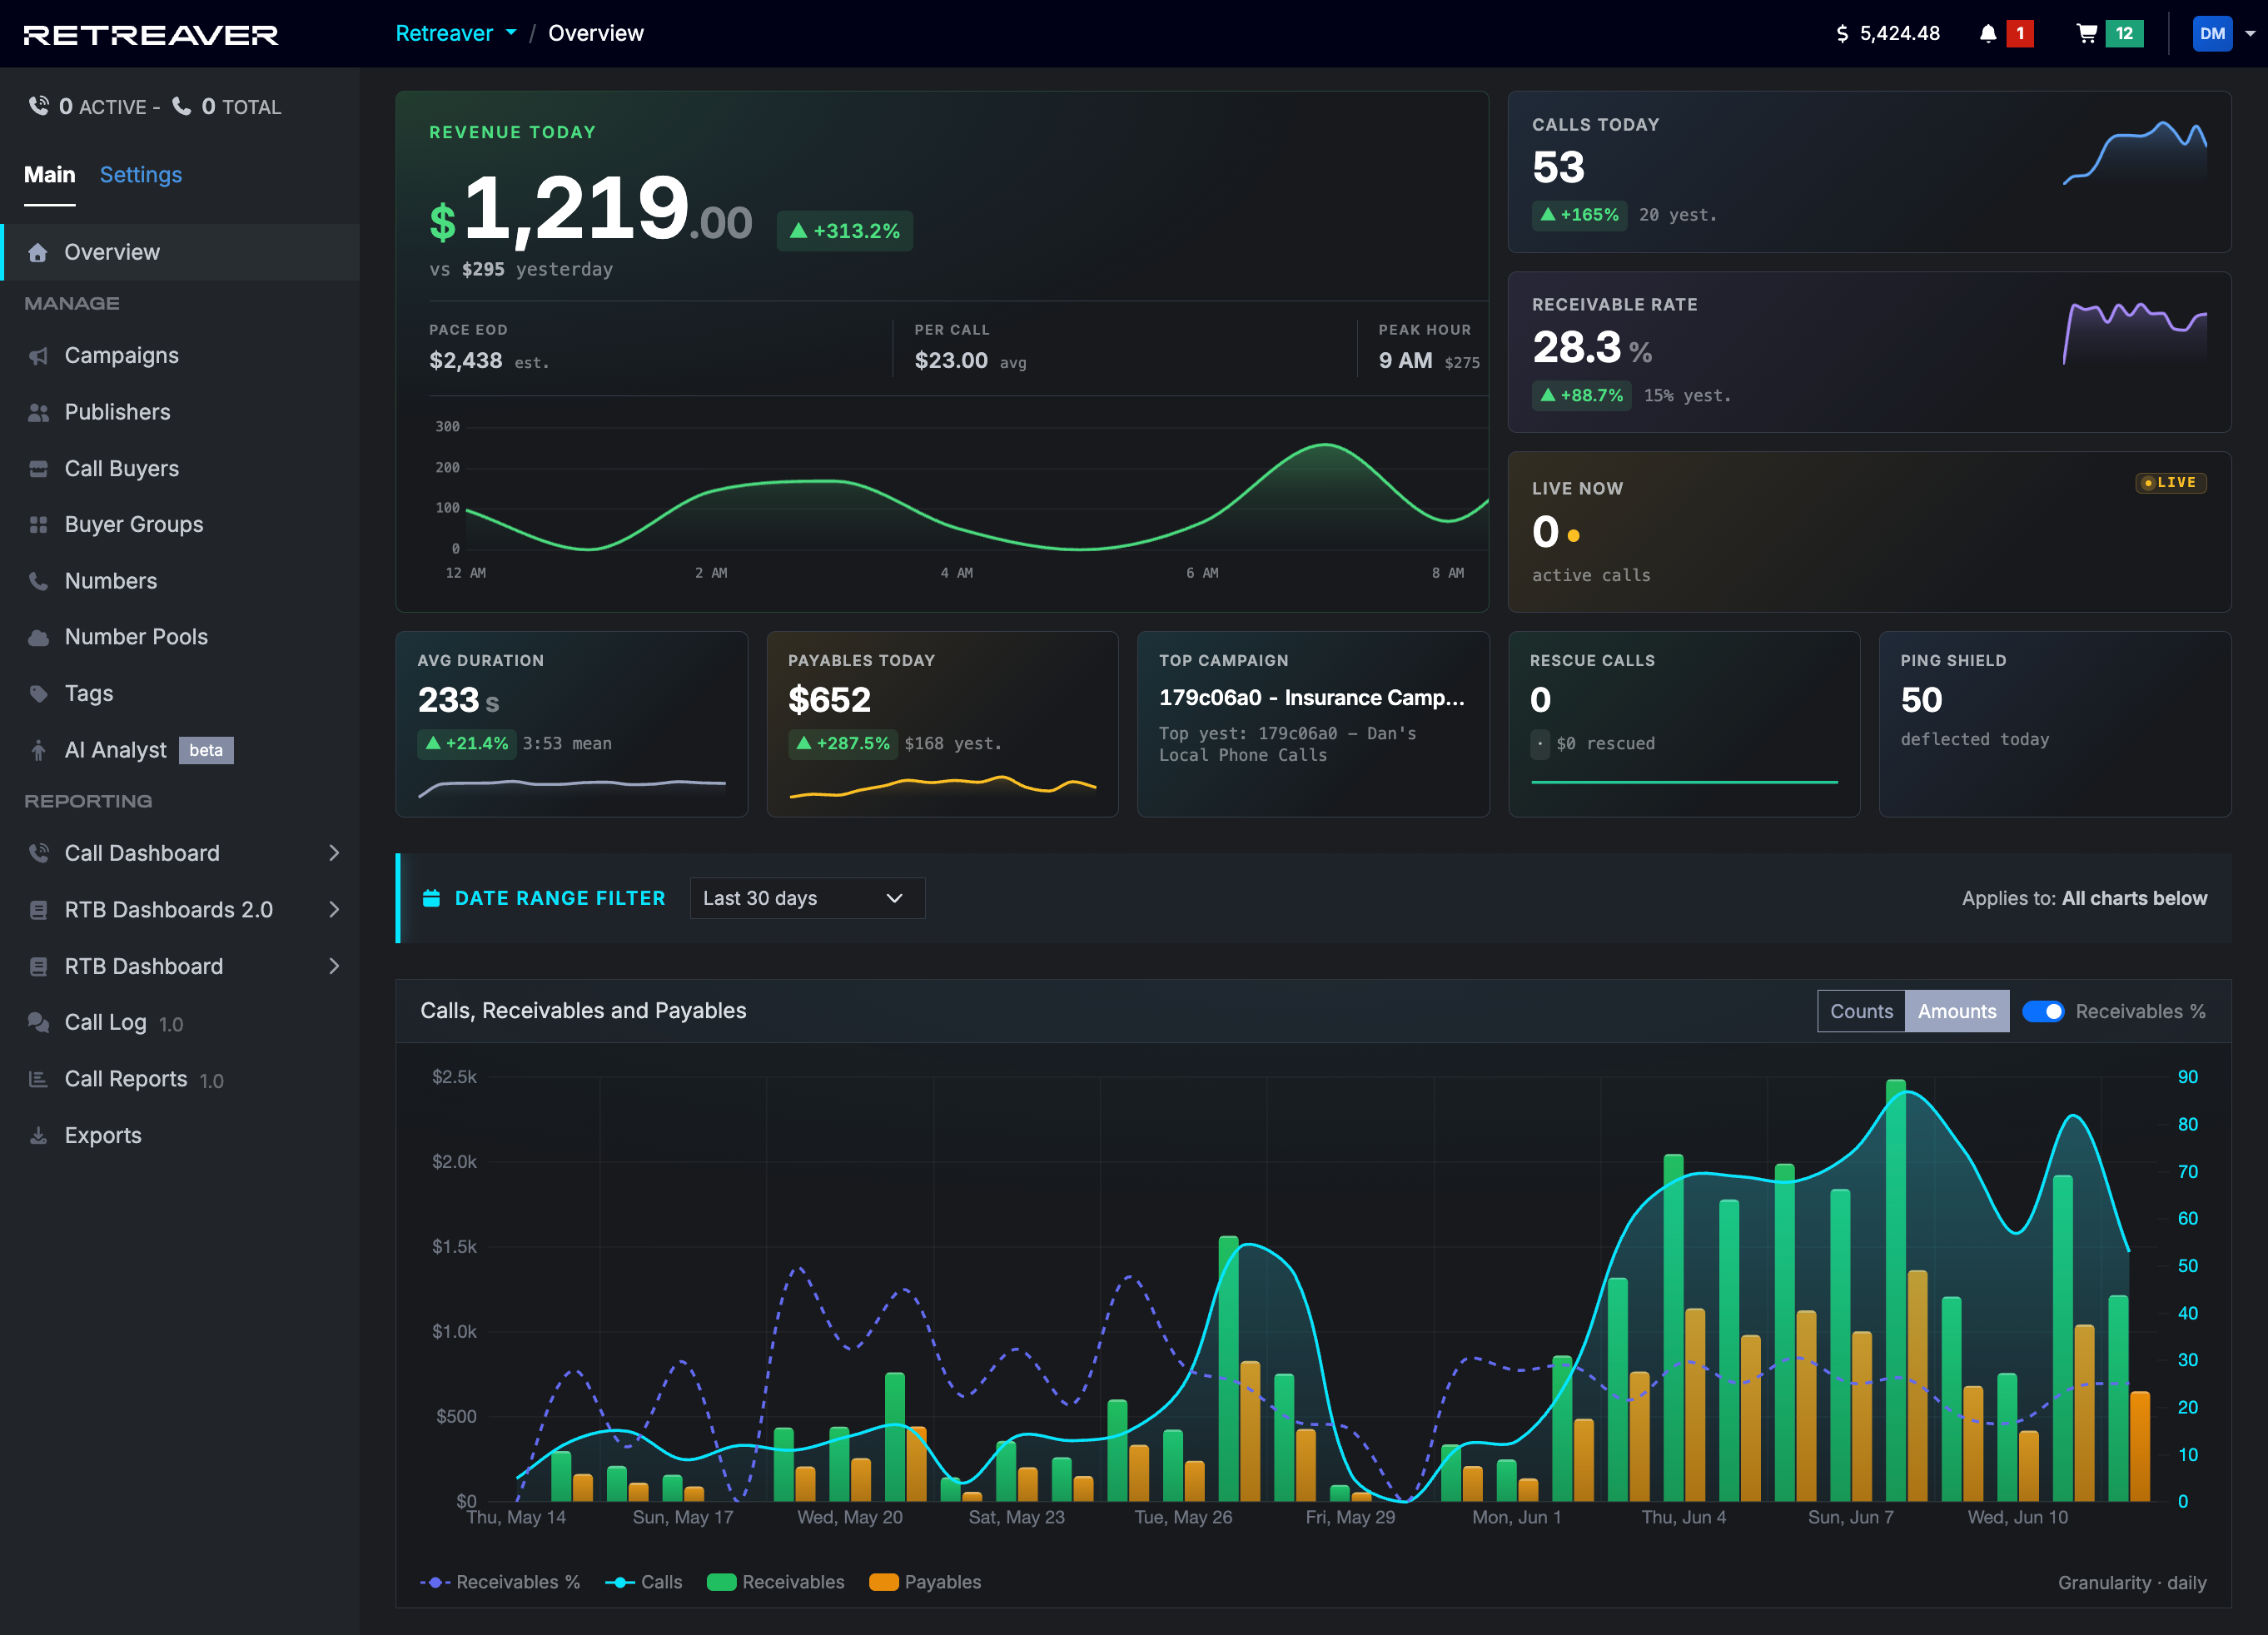
The Overview is now a live command center. It pulls your calls, revenue, costs, and top performers into a single, beautifully visualized page that updates in near real time — so the page you open first is also the page that tells you the most.
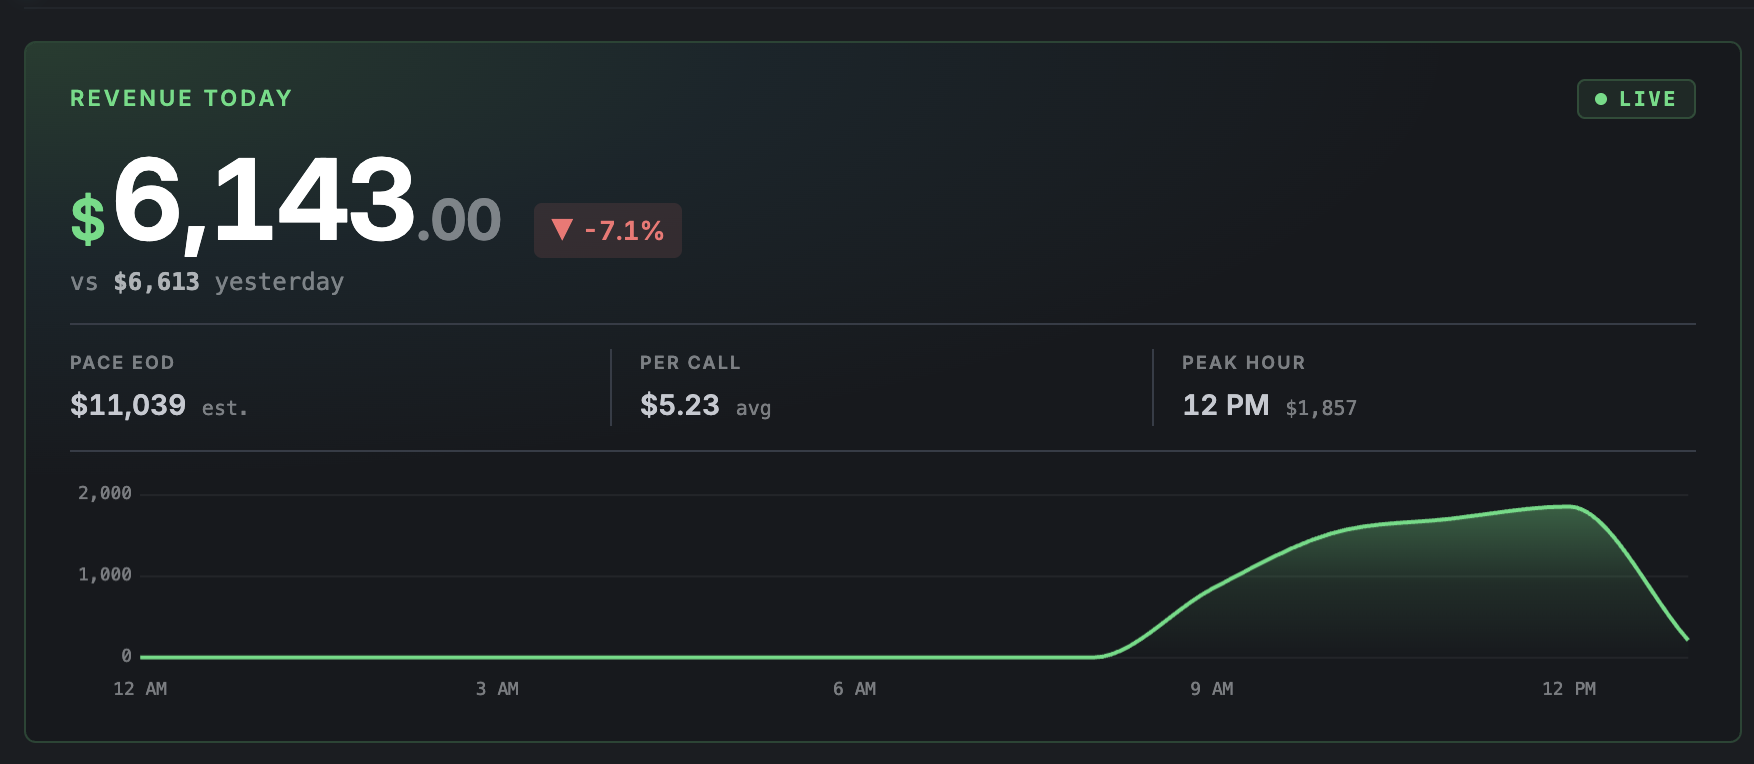
Pace EOD — your projected end-of-day revenue
The headline metric. Pace EOD projects where your revenue will land by the end of the day, kicking in just a couple of hours into your day. It turns a morning’s worth of calls into a powerful, near real-time estimate of your finish — so you can course-correct while it still matters, not after the day is over.
At-a-glance KPI widgets
A row of compact KPI widgets keeps the numbers that matter in front of you — calls, receivables, and payables — so you can instantly track the balance between what’s coming in and what’s going out without leaving the page.
Top Performance Chart
See your top performers at a glance. The Top Performance Chart surfaces who and what is driving your results, so you can double down on what’s working and keep your campaigns running at peak efficiency.
Hour × Day Call Density
Decode the rhythm of your traffic. The Hour × Day Call Density view shows when your calls actually happen, hour by hour, so you can spot your busiest windows and staff, schedule, and budget around them.
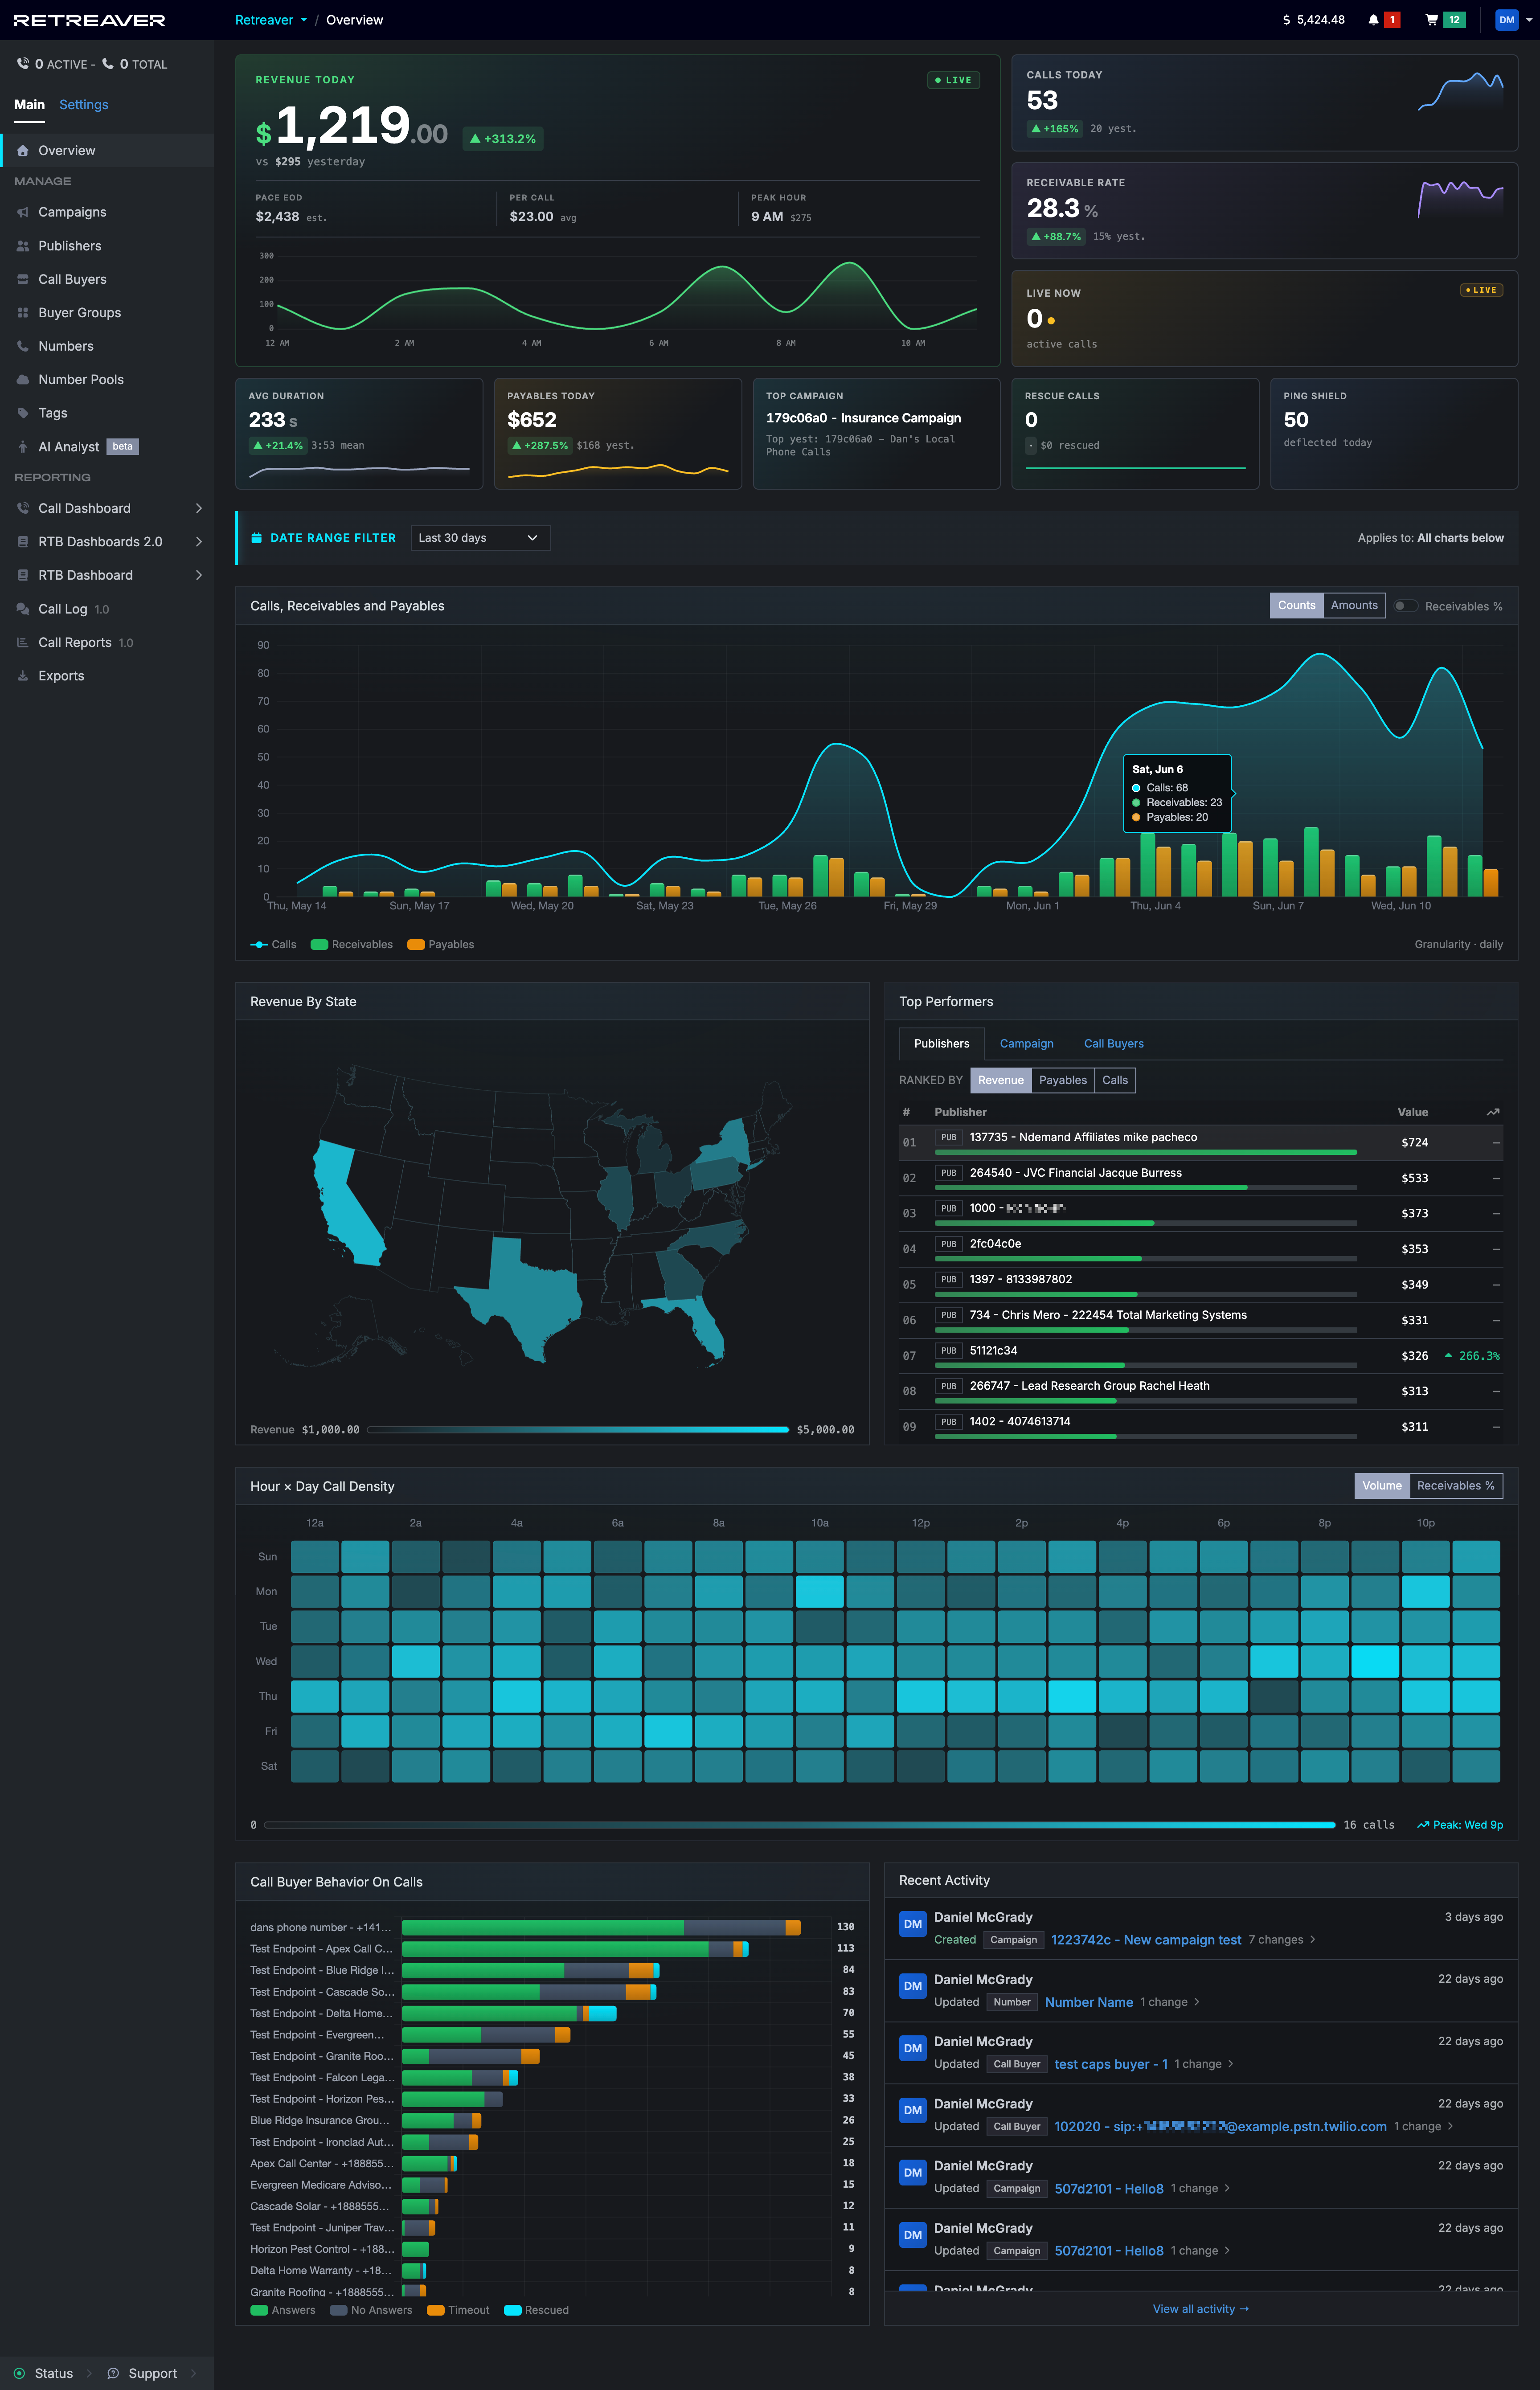
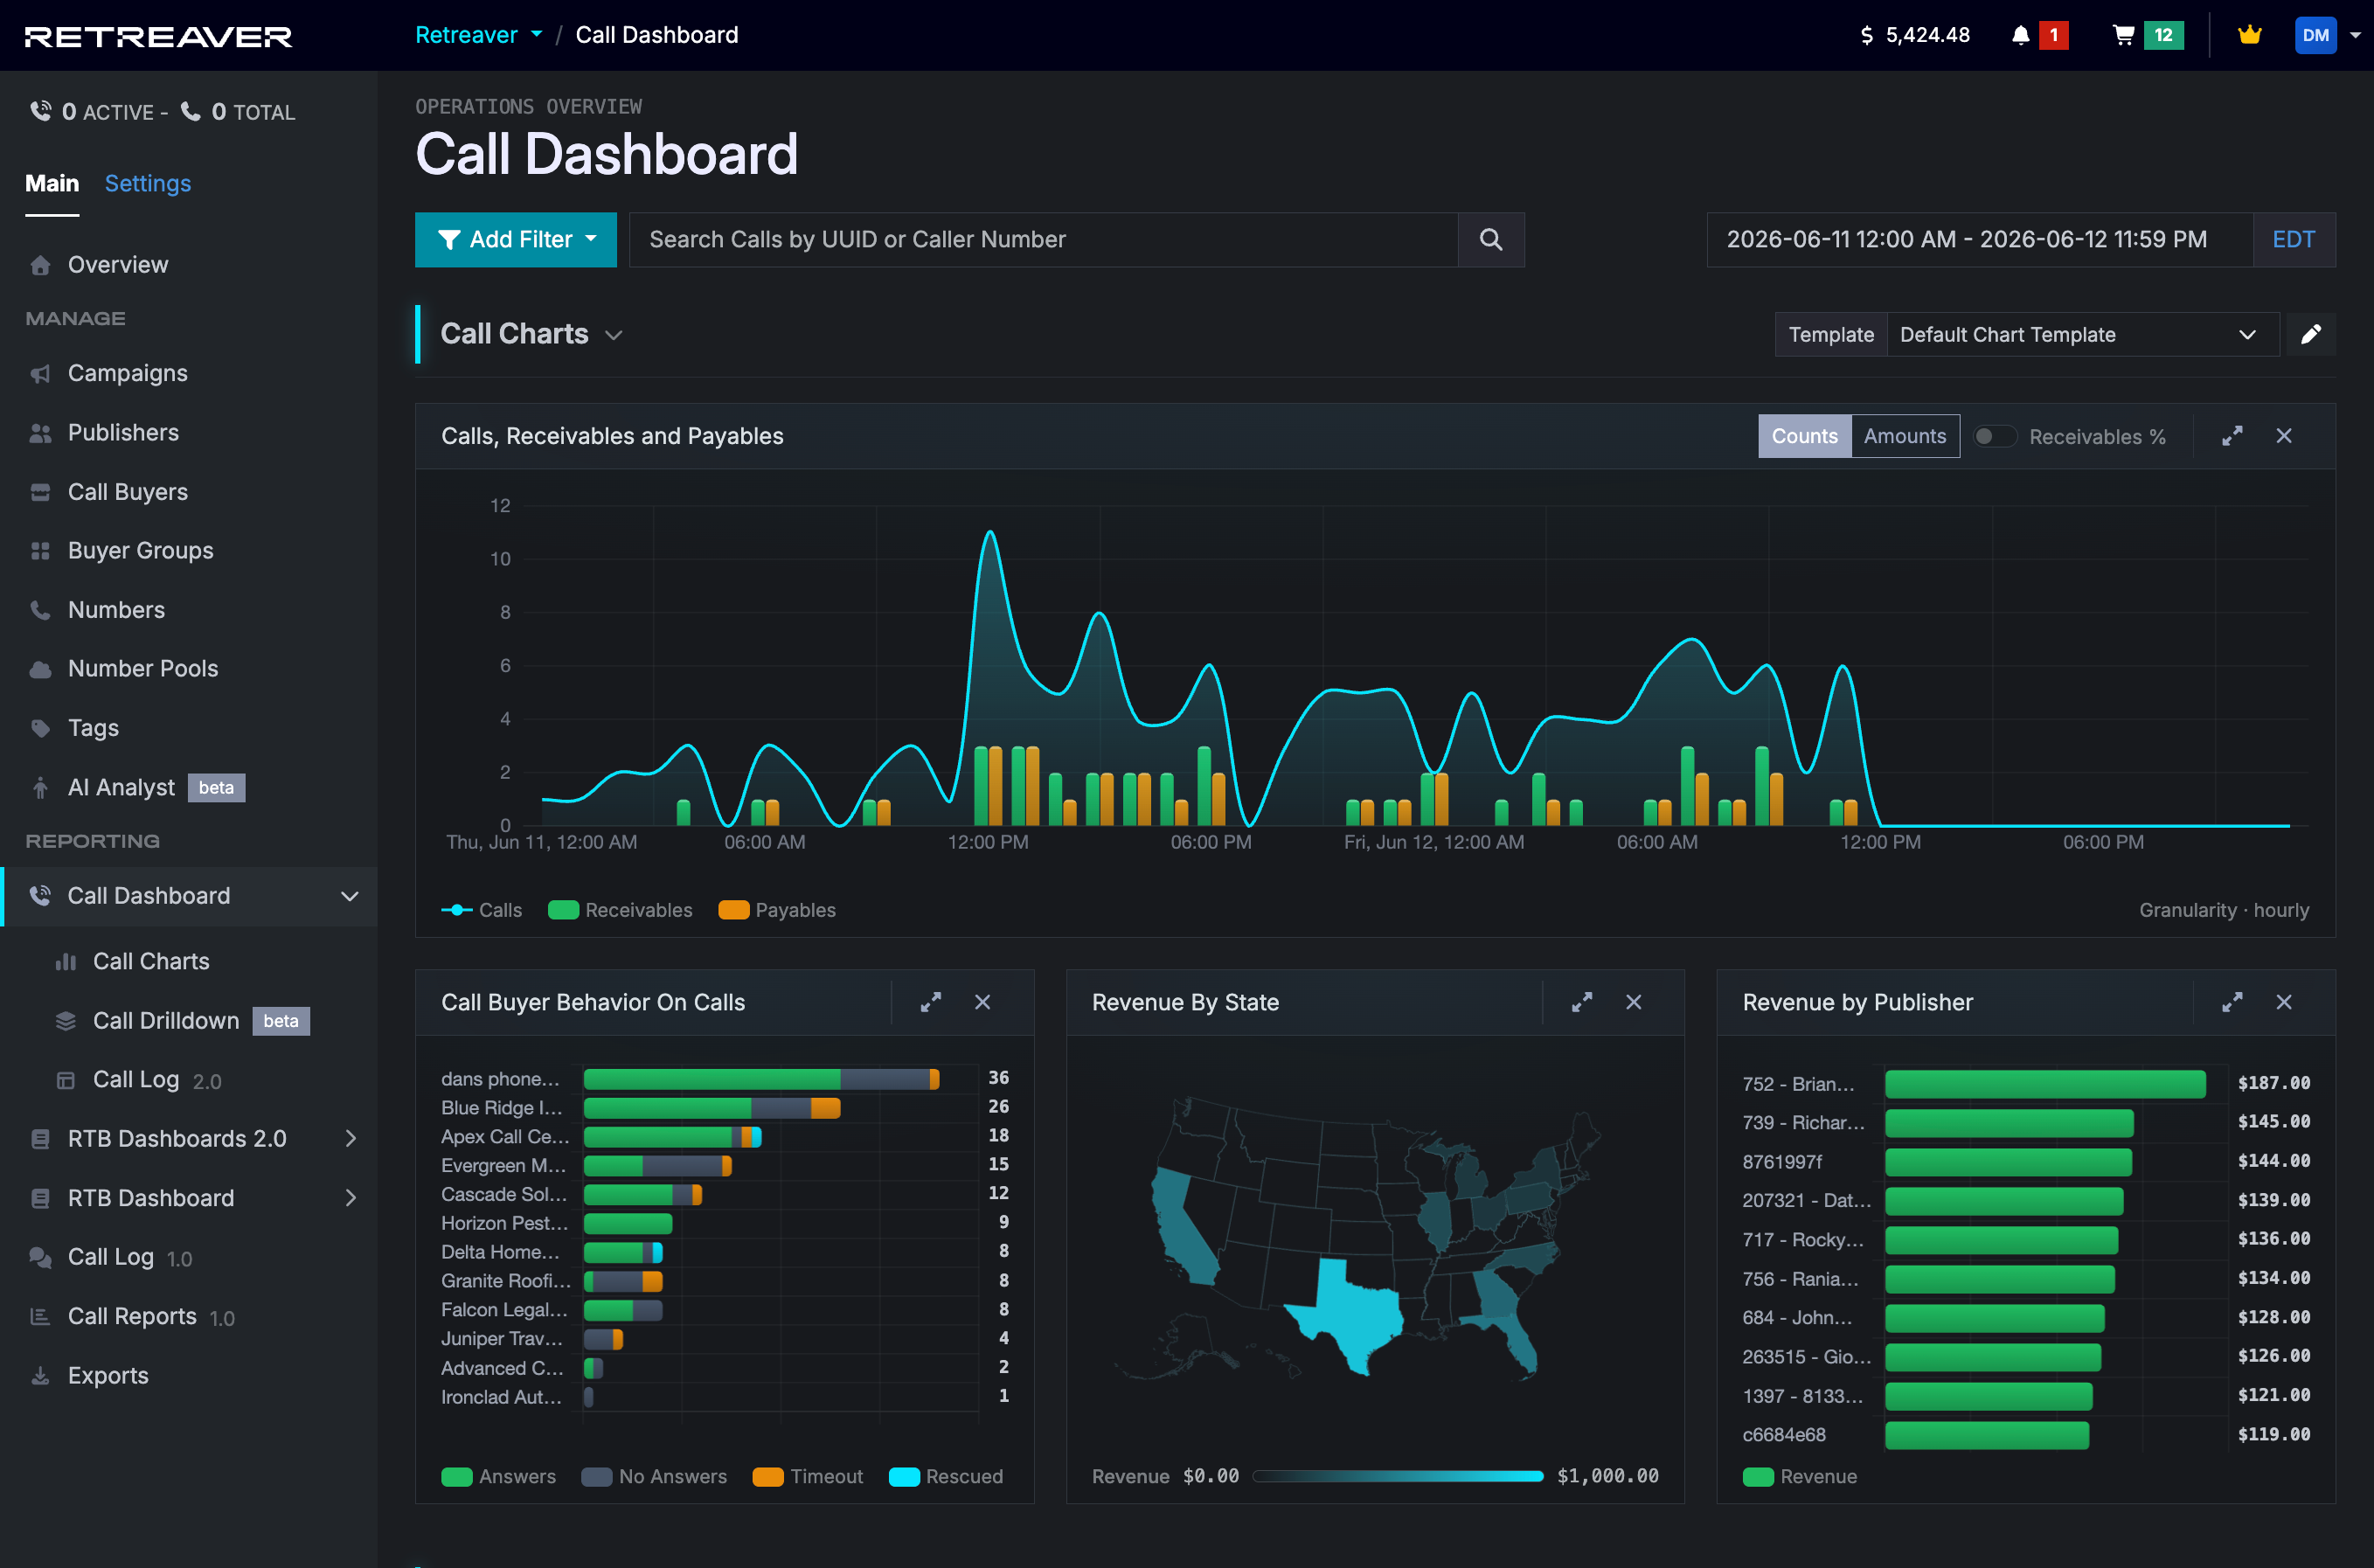
Revenue by State
Monitor your top-performing regions at a glance. The Revenue by State map breaks down where your revenue is coming from geographically, making it easy to see which markets are carrying the day.
Experience the new Retreaver
Visualize your traffic and revenue, track the balance between calls, receivables, and payables, identify your top performers, and decode call buyer behavior — all from the first screen you see. Your data, beautifully visualized and ready for action.
Help us improve this article or request new support guides.
Previous
Connect RTB calls over SIP — a SIP address on every reservation
Next
Change history for Webhooks and Postback Keys